Economic uncertainty is affecting every business these days, but not always in the same way—which is why peer performance data is invaluable in these challenging times. But how to get it?
To help you gain a better picture of how and what your competitors are doing, as well as how your company stacks up, Chief Executive reached out to more than 600 CEOs, presidents, owners and CFOs at U.S.-based companies of nearly every size and sector. We asked them to share key KPI data, really nitty-gritty stuff like pricing changes, staffing costs and turnover data, how many days receivables/payables are taking, changes in R&D budgets and more, and then we analyzed it all and sliced it up in every way you can think of, by size, by industry, and so on.
The results? They were eye-opening, to say the least—and obviously a lot more than we could cram into an issue of the magazine—so we put the full results in a new study, Chief Executive Group’s 2022 Financial Benchmarks Report for U.S. Companies. For now, here are some of the top-line results we found most interesting. How do you compare?
Prices, Revenues
According to our survey, 41 percent of U.S. companies are projecting their annual revenues to grow by 10 percent or more in 2022. A big contributing factor to this, of course, are the inflation-driven price increases companies are implementing.
More companies are raising prices in 2022 than in 2021—81 percent vs. 72 percent. The extent of those increases varies, but the great majority report numbers between 2.5 percent and 15 percent.
And while small companies (by annual revenues) tend to be more reluctant to increase prices compared to their larger peers, they are also the group with the highest proportion forecasting revenue declines this year—which showcases the importance of price increases in navigating this environment.
As one might expect, sector also plays a prominent role. For instance, 53 percent of manufacturing companies focused on consumer goods forecast ending 2022 with revenue growth in excess of 10 percent—the largest rate across all sectors. It’s no coincidence that these are also among the companies most likely to implement substantial price increases (7.5 percent or more) in 2022, compared to other industries.
Net revenue per employee is another important metric to consider in this economy, as labor costs continue to skyrocket. According to our research, median total net revenue per employee in 2021 was $225,000, with 35 percent reporting theirs falling between $100,000 and $199,000.
And while company size has a direct correlation to this metric, it also varies largely based on industry: 30 percent of wholesale/distribution companies and 22 percent of energy companies have total net revenue per employee of at least $1 million, far more than any other sector.
Rising Costs
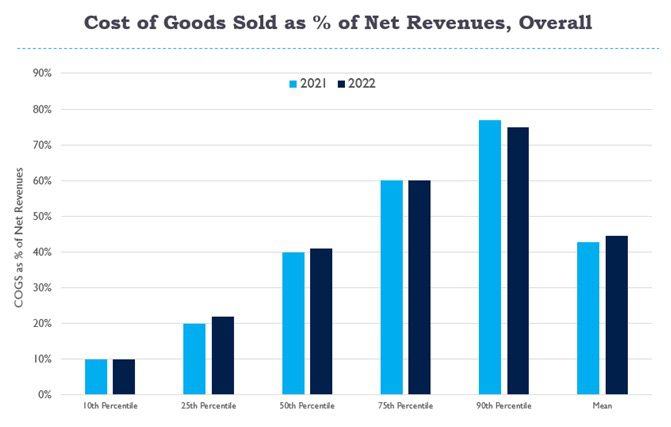
When we’re talking inflation, we’re of course talking costs. So how is it hitting companies? We found that the median projected cost of goods sold (COGS) as a percentage of net revenues is 41 percent in 2022 (average of 45 percent), an increase from 2021 (40 percent and 43 percent, respectively). While a 1 percent increase may seem modest, it can have a material impact on profit margins.
Construction companies have the highest COGS in 2022, with a median of 73 percent—down from 75 percent in 2021 but the highest across all sectors.
In response to rising wages, 52 percent of companies said they are increasing or have increased prices to match wage increases. Overall, the larger the company (by annual revenues), the more likely it is to invest in automation to curb the impact of wage increases, particularly when it comes to back-office operations.
In the restaurant industry, 75 percent of companies said they are increasing prices in line with wages, and 58 percent said they are investing in automation to reduce the number of employees specifically in response to rising wages. This is only second to the retail industry, where the study found 60 percent of companies were adopting the same strategy.
Profit Expectations
In our current economy, all eyes are on profitability. While median EBITDA in 2022 is 14 percent of net revenue, according to the benchmarking study, average EBITDA as a percentage of net revenue is projected to be 16 percent, down from 17 percent in 2021.
Here, too, size plays a role, but this time, the peer groups at both ends of the scale show an advantage. Companies with less than $10 million in annual revenues and those with more than $1 billion in annual revenues enjoyed the highest median EBITDA as a percentage of net revenues in both 2021 and 2022, at 15 percent.
As for sector (another important component when benchmarking performance), the study found real estate and pharma as the two industries with the highest median EBITDA as a percentage of net revenue in 2022. Real estate, at 23 percent, showed no change from the year prior, but pharma/biotech, at 18 percent, is down from 23 percent in 2021.
When evaluating EBITDA per employee, a figure of less than $50,000 is quite common, and nearly 40 percent of companies represented in the benchmarking study reported that figure. Fewer than a quarter reported EBITDA per employee of $150,000 or more.
As you’d expect, sector is critical, and it’s been good to be in the energy business. One-third of energy companies polled reported EBITDA per employee of at least $400,000—the highest of all industries. No energy company reported EBITDA per worker under $50,000 for 2022. Will that last into a recession? We’ll see.


